'admin'에 해당되는 글 43건
- 2013.01.08 SQL Server tempdb 복구
- 2011.08.14 Admin:: SQL Server 에러로 다른 서버에서 Rebuilding 처리
- 2011.04.15 T-SQL:: Default Trace로 DB 증가량 확인 1
- 2011.01.10 Admin::Superdome VS DL580 G7
- 2010.11.23 Admin:: LOG Rebuild
- 2010.09.06 DBCC ShrinkFile
- 2010.06.04 Install Tip
- 2010.06.04 SQL Server의 Procedure Cache 사이즈
- 2010.06.04 Profiler
- 2010.06.04 문서화되지 않은 프로시저
- 2010.06.04 데이터베이스 사이즈
- 2010.06.04 Raid구성성능
- 2010.06.04 DB파일사이즈 1
- 2010.06.04 DBCC 명령어
- 2010.06.04 복제::#5 구현&삭제 스크립트
tempdb 복구
tempdb는 SQL Server에서 정렬, GROUP BY를 사용한 집계, 커서 사용, 임시테이블 및 테
이블변수 사용, 일부 JOIN, SORT_IN_TEMPDB 옵션을 사용한 인덱스 생성, 데이터베이스
의 복구 작업 등에서 사용됩니다. 따라서, 손상 시에는 이와 같은 작업들을 진행할 수 없게
됩니다. tempdb의 손상 시 tempdb를 사용하는 작업은 다음과 같이 913 오류를 발생하며
정상적으로 실행되지 않습니다.
또한, tempdb의 size나 경로를 잘못 설정하여 SQL Server가 시작 시 정상 상태가 아닐 경우도 문제가 발생합니다.
tempdb가 주의 대상일 경우 재 시작 만으로 복구되기도 하지만 아닐 경우도 있습니다.
이럴 경우 최소 로그 이면서 tempdb를 skip 하면서 SQL 서버를 수동으로 시작 해야 합니다.
1. 명령 프론트를 실행하고 SQL Sever 실행된 경로로 이동 한다.
2. tempdb 없이 실행하는 추적플래그 –T3609, 자동으로 실행하는 저장 프로시저를 실행하지 않게 하는 플래그 –T4022로 실행합니다.
3. 경우에 따라 최소 옵션인 –f도 포함합니다. , -m : 단일 사용자 모드
실행하는 명령창은 닫지 말고 그대로 둡니다.
Sqlservr.exe –c –f –m –T3609 –T4022
net start MSSQLSERVER /f /c /m /T 3609 /T4022
4. 경로가 잘 못 되었거나, size가 잘 못 되었을 경우 정보를 Alter database 구문을 통해 수정 합니다.
5. SQL Server 2000 이하의 경우 주의 대상을 정상 상태로 변경 하기 위해서
exec sp_resetstatus ‘tempdb’
명령으로 강제로 복원 할 수도 있습니다.
6. 3번의 실행 명령창에 Ctrl + c를 입력한 다음 “Y” 키를 눌러 SQL Server를 종료후 정상적으로 서비스를 기동 합니다.
7. tempdb에 문제가 없는지 확인 합니다.
'Common Admin' 카테고리의 다른 글
| TokenAndPermUserStore (0) | 2015.05.18 |
|---|---|
| Database Landscape map – February 2013 (0) | 2013.03.13 |
| tablediff 유틸리티 (0) | 2012.11.01 |
| Admin::2000용 TEST DB 생성. (0) | 2011.10.05 |
'Common Admin' 카테고리의 다른 글
| tablediff 유틸리티 (0) | 2012.11.01 |
|---|---|
| Admin::2000용 TEST DB 생성. (0) | 2011.10.05 |
| Admin::Cache Flush 가 발생하는 경우 (0) | 2011.03.30 |
| Admin::Configuring Windows 2003 ( x64 ) for SQL Server (0) | 2010.12.28 |
EventClass : 92, 93, 94, 95 번은 DB File의 증가하거나 Shrink 하는 이벤트 임.
Default Trace가 되고 있는 SQL Server에서는 해당 이벤트를 수집하고 있으며, 증가/축소되는 사이즈를 확인할 수 있다.
begin try
if (select convert(int,value_in_use) from sys.configurations where name = 'default trace enabled' ) = 1
begin
declare @curr_tracefilename varchar(500) ;
declare @base_tracefilename varchar(500) ;
declare @indx int ;

select @curr_tracefilename = path from sys.traces where is_default = 1 ;
set @curr_tracefilename = reverse(@curr_tracefilename);
select @indx  = patindex('%\%', @curr_tracefilename) ;
set @curr_tracefilename = reverse(@curr_tracefilename) ;
set @base_tracefilename = left( @curr_tracefilename,len(@curr_tracefilename) - @indx) + '\log.trc'


select  @@SERVERNAME as server_name
,	    (dense_rank() over (order by StartTime desc))%2 as l1
,       convert(int, EventClass) as EventClass
,       DatabaseName
,       Filename
,       (Duration/1000) as Duration
,       StartTime
,       EndTime
,       (IntegerData*8.0/1024) as ChangeInSize
from ::fn_trace_gettable( @base_tracefilename, default )
where EventClass >=  92      and EventClass <=  95        and ServerName = @@servername
order by StartTime desc ;
end     else
select -1 as l1, 0 as EventClass, 0 DatabaseName, 0 as Filename, 0 as Duration, 0 as StartTime, 0 as EndTime,0 as ChangeInSize
end try
begin catch
select -100 as l1
,       ERROR_NUMBER() as EventClass
,       ERROR_SEVERITY() DatabaseName
,       ERROR_STATE() as Filename
,       ERROR_MESSAGE() as Duration
,       1 as StartTime, 1 as EndTime,1 as ChangeInSize
end catch
'Monitoring' 카테고리의 다른 글
| TEMPDB의 페이지 사용량 측정 (0) | 2012.08.13 |
|---|---|
| 모니터링::Index 생성 & Rebuild 진행 상황 (0) | 2011.12.06 |
| Admin::Tempdb 의 작업, 모니터링 (0) | 2011.01.30 |
| T_SQL::SP_WHO2 + DBCC (0) | 2010.06.03 |
Superdome VS DL580 G7 간단 비교 자료입니다.
하드웨어 사양비교
|
Model |
HP Proliant DL580 G7 Serise |
HP SUPERDOME SD32B |
Comment |
|
CPU |
Intel Xeon 7560 4CPU * 8Core |
Itanium2 1.60GHz 32CPU * 2Core |
|
|
Memory |
256GB |
512GB |
|
|
CPU 출시년도 |
2010년 |
2005년 |
|
|
SQL Price |
1억 2천? |
4억 5천 ? |
정확하지 않음 |
|
H/W Price |
4천? |
5억? |
정확하지 않음 |
TPC-C 테스트 결과로 보는 성능비교 (참고사이트 http://www.tpc.org)
Tpmc(transactions per minute) 순위에서 볼 수 있듯이 DL580이 Superdome보다 한 등급 위에 있는 것은 사실인 듯 합니다.
'ETC' 카테고리의 다른 글
| Windbg 명령어 & 설치 (0) | 2014.11.06 |
|---|---|
| Window 서비스 등록/삭제 방법 (0) | 2011.10.20 |
| 믹시 가입 (0) | 2010.10.13 |
| 네할렘 아키텍쳐 (0) | 2010.06.10 |
- Data File은 이상이 없고, SQL 서버 서비스가 정상 종료 되었을 경우 처리 할 수 있다.
- LOG 파일만 트랜잭션이 맞지 않거나 그럴 경우 문제 발생시
- TEST DB의 DB 스토리지 copy 했는데 copy 시점에 트랜잭션이 완료 되지 않은 상태에서 시작되어 copy 되었을 경우
- DB가 정상적으로 Detatch 될 때 사용 가능 하다.
CREATE DATABASE TEST ON (NAME = 'TEST_DATA', FILENAME = 'F:\MSSQL\DATA\TEST _DATA.MDF')
--,(NAME = 'SEARCHV_LOG', FILENAME = 'F:\MSSQL\LOG\SEARCHV_LOG.LDF')
FOR ATTACH_FORCE_REBUILD_LOG
-- 이건 기존 동일한 경로에 로그 파일을 생성합니다.
그러니까 기존 로그 파일을 이름 변경 해야 합니다.
상황 2)
- 트랜잭션 로그 파일이 손상되었을 때
- update, delete 작업 도중 rollback이 시도 했으나 오랜 시간이 걸려서 기다릴 수가 없을때, (서비스 open이 코 앞일때)
- 단, 이 작업은 정합성이 유지 되지 않을 수도 있다.
--1. DB를 offline 시킵니다. ,
롤백 중이라면 offline 할때도 오래 걸립니다. 롤백이 완료 될때 까지 기다기리 때문입니다.
클러스터 장비로 되어 있다면 강제로 그룹 이동 시킵니다.

-- 2. log 파일 이름을 변경합니다.

-- 3. DB online 합니다.

-- 4.  주의 대상으로 DB가 올라오게 됩니다.
ALTER DATABASE TEST SET EMERGENCY
go

-- 5. 디비가 물리적으로 문제가 있는지 확인 합니다. 해당 작업은 대용량 DB는 오래 걸립니다. 무시하시고 가셔도 됩니다.
-- 문제가 없으면 결과에 문제 없음으로 나옵니다. 어느 정도 문제가 있는것도 6번 단계에서 복원 될 수도 있습니다
 DBCC CHECKDB (문제DB)

-- 6.
ALTER DATABASE TEST SET SINGLE_USER  with ROLLBACK IMMEDIATE
go
DBCC CHECKDB (문제DB명, REPAIR_ALLOW_DATA_LOSS)

-- 7.
ALTER DATABASE TEST SET MULTI_USER with  ROLLBACK IMMEDIATE

-- 8 . LOG Rebuild 작업
ALTER DATABASE TEST REBUILD LOG ON
(NAME=TEST_LOG,FILENAME='F:\MSSQL\LOG\TEST_LOG.LDF'
, SIZE = 30720MB, file_growth = 500MB)

-- 10.ONLINE 상태가 되는지 확인

참고) DBCC REBUILD_LOG 상용해서도 가능합니다. 허나, 이건 단일 로그일때만 가능합니다.
DBCC REBUILD_LOG ('db_name', 'log_file_name')
'Common Admin' 카테고리의 다른 글
| Admin::Cache Flush 가 발생하는 경우 (0) | 2011.03.30 |
|---|---|
| Admin::Configuring Windows 2003 ( x64 ) for SQL Server (0) | 2010.12.28 |
| waitresource 값 확인 (0) | 2010.11.01 |
| MCITP 취득 방법 (0) | 2010.10.06 |
SET NOCOUNT ON
DECLARE @shrinkUnitSize INT, @TotalSizeMB INT, @filename varchar(50), @start_time datetime, @idx int
SET @shrinkUnitSize = 500
SELECT @TotalSizeMB = size/128, @filename= name FROM master..sysaltfiles where dbid=db_id('dba') and fileid =1

SELECT @TotalSizeMB AS CurrentSizeMB, GETDATE() AS StartTime

SET @idx = 1
WHILE (@TotalSizeMB > 300000)-- 현재사이즈가GB보다클때줄이는작업(file사이즈를GB아래로조정하는작업)
BEGIN
         SET @start_time = GETDATE()
         SET @TotalSizeMB = @TotalSizeMB - @shrinkUnitSize
         DBCC SHRINKFILE (@filename, @TotalSizeMB) WITH NO_INFOMSGS

--         SELECT @idx as idx, @TotalSizeMB as TotalSizeMB, DATEDIFF(s, @start_time, getdate()) as duration

         PRINT 'idx = ' + CAST(@idx AS varchar(10)) + ', totalSizeMB = ' + CAST(@TotalSizeMB AS varchar(10)) + ', duration = ' + CAST(DATEDIFF(s, @start_time, getdate()) AS varchar(10))

              if DATEDIFF(s, @start_time, getdate() ) < 10 -- 줄어드는시간이10초이하로떨어지면5GB단위로줄임
                    SET @shrinkUnitSize = 5000

         SET @idx = @idx + 1
END

SELECT @TotalSizeMB AS ShrinkSizeMB, GETDATE() AS EndTime
GO
'T-SQL' 카테고리의 다른 글
| T-SQL:: TCP 포트 정보 (0) | 2011.08.13 |
|---|---|
| T-SQL:: INDEX-중복인덱스 제거. (1) | 2011.08.13 |
| [T-SQL] JOb 수행 시간 완료 계산 (0) | 2010.07.19 |
| Index::Defrag Script v4.0 (0) | 2010.06.15 |
출처: http://www.nextstep.co.kr/69
SQL Server를 인스톨 할 때 선택한 정렬 순서(sort order)가 성능에 영향을 끼칠 수 있다. 정렬 순서 가운데에
는 비록 그 결과가 클라이언트 프로그램에서 문제를 일으키긴 하지만 이진 정렬이 가장 속도가 빠르다. 디폴
트로 선택되는 "사전 순서(dictionary order), 대소문자 구분 안함(case-insensitive)"이 그 다음으로 빠르며 아
마 여러분은 보통 이것을 사용할 것이다. "사전 순서, 대소문자 구분 안함, 액센트 구분 안함(accent-
insensitive), 대문자 선호(uppercase preference)"와 "사전 순서, 대소문자 구분함(case-sensitive)"는 속도면
에서 뒤쳐진다. 프로그램의 성능과 요구사항에 가장 적합한 정렬 순서를 선택하도록 한다. [6.5, 7.0, 2000]
(마이크로소프트의 보다 자세한 정보 :
http://msdn.microsoft.com/library/default.asp?
URL=/library/psdk/sql/8_ar_da_10.htm)
*****
SQL Server를 인스톨 할 때 선택하는 네트워크 라이브러리도 서버와 클라이언트 간의 통신 속도에 영향을 준
다. 사용 가능한 세 개의 네트워크 라이브러리 중에서 TCP/IP가 가장 빠르며 멀티 프로토콜이 가장 느리다.
TCP/IP의 속도가 빠르므로 서버와 클라이언트 모두 TCP/IP를 사용하는 것이 좋으며 사용하지 않는 라이브러
리는 불필요한 오버헤드만 가중시키므로 인스톨 하지 않는 편이 바람직하다. [6.5, 7.0, 2000]
(마이크로소프트의 보다 자세한 정보 :
http://msdn.microsoft.com/library/default.asp?
URL=/library/psdk/sql/1_server_6.htm)
*****
일반적으로 여러분은 가장 최신의 SQL Server 서비스 팩을 인스톨 하고 싶을 것이다.
사실상 SQL Server 6.5와 7.0의 서비스 팩에서 성능에 영향을 줄 수 있는 버그는 모두 해결된 상태이다. 그러
나 잘 아는 바와 같이 새로운 서비스 팩이 나오자 마자 성급하게 인스톨 하는 것은 좋지 않으며 최소한 2~4주
정도 SQL Server 뉴스그룹 등을 관찰하면서 새로운 서비스 팩이 중대한 문제를 안고 있지는 않은지 확인하는
것이 좋다. [6.5, 7.0, 2000]
2. 파일 위치에 관한 팁
master, msdb 그리고 model 데이터베이스는 운영 환경에서 그다지 많이 사용되지는 않기 때문에 이들 데이터
베이스의 물리적인 위치는 별로 중요하지 않다. [6.5, 7.0, 2000]
*****
데이터베이스 파일(.mdf)과 로그 파일(.ldf)을 별도의 디스크 어레이에 위치시켜서 읽기와 쓰기 작업이 충돌하
는 경우가 감소하도록 서로 분리시킨다. [6.5, 7.0, 2000]
데이터베이스 파일(.mdf)을 저장할 때에는 RAID 10 어레이에서 가장 뛰어난 성능을 보여준다. RAID 10 어레이
가 너무 비싸다면 RAID 5 가 그 다음으로 좋은 선택이 될 수 있다. 각 RAID 어레이는(5 또는 10) 컨트롤러가 지
원하는 한 여러 개의 물리적인 디스크를 어레이 안에 가질 수 있다. 이런 점으로 해서 어레이의 각 물리적 드
라이브에 읽기와 쓰기 작업이 동시에 진행될 수 있으며 디스크 I/O 처리 능력이 크게 늘어나게 된다.
*****
데이터베이스 로그 파일(.ldf)을 저장할 때에는 RAID 1 어레이(미러링)에 저장하는 것이 가장 최적의 성능을
보이는 경우가 많다. 여기서는 RAID 1 어레이에 오직 하나의 로그 파일이 존재한다고 가정하였다. RAID 1 어레
이에 하나의 로그 파일만 존재하면 파일을 순차적으로 쓸 수 있기 때문에 로그 기록 작업이 빨라지게 된다.
그러나 만약 RAID 1 어레이를 공유하는 로그 파일이 여러 개 있다면(여러 개의 데이터베이스로부터) RAID 1
어레이를 사용하는 장점이 거의 사라진다. 로그 기록 작업은 여전히 순차적으로 이루어 지지만 동일한 어레이
에 여러 개의 로그 파일이 존재하면 이 어레이는 더 이상 순차적으로 기록할 수 없고 랜덤하게 쓰기 작업을 해
야 하므로 RAID 1 어레이의 이점을 상쇄해 버리기 때문이다.
그러나 RAID 1 어레이가 RAID 5 어레이보다 랜덤 쓰기를 더 많이 처리할 수 있다면 RAID 5 어레이 보다는
RAID 1 어레이가 아직도 더 좋다고 볼 수 있다. 확실하게 알기 위해서 여러분의 하드웨어를 확인해 보기 바란
다. 다른 방법으로는 데이터베이스들의 로그를 각각 별도의 RAID 1 어레이에 저장하는 것이다. 또는 RAID 1
과 RAID 5의 장점만을 모은 RAID 10 어레이에 로그 파일을 저장하는 것도 생각해 볼 수 있다. 많은 비용이 들
어가겠지만 최고의 성능을 제공한다. [6.5, 7.0, 2000]
*****
데이터베이스의 규모가 매우 크고 작업량도 많다면 성능을 향상 시키기 위해서 여러 개의 파일을 사용해 볼
수 있다. 예를 들어 조회 작업이 매우 많은 천만건의 레코드를 가진 테이블이 하나 있다고 하자. 이 테이블이
하나의 데이터베이스 파일에 존재하고 있다면 레코드를 순차적으로 읽기 위해서 SQL Server에서는 단지 하나
의 쓰레드만을 사용한다. 그러나 만약 이 테이블이 세 개의 물리적 파일로 분산되어 있다면 테이블을 순차적
으로 읽을 때 SQL Server는 세 개의 쓰레드(한 파일에 하나씩)를 사용하므로 작업 속도가 훨씬 빨라지게 된
다. 게다가 각 파일이 별도의 디스크나 디스크 어레이에 존재하고 있다면 성능은 한층 배가된다.
본질적으로 큰 테이블이 여러 개의 물리적인 파일로 나누어 질수록 성능이 높아질 가능성이 더 커진다. 물론
서버의 I/O가 한계 값에 도달하게 되면 더 이상 쓰레드가 추가되어도 성능 향상에는 별로 도움이 되지 못하게
된다. 하지만 서버의 I/O가 한계 값에 도달할 때 까지는 쓰레드(그리고 파일)가 늘어날수록 성능도 함께 증가
하게 된다. [7.0, 2000]
3. 서버 설정에 관한 팁
SQL Server 6.5를 사용하고 있다면 서버의 물리적인 RAM에 따라서 8MB 또는 16MB로 결정되는 디폴트 메모
리 세팅을 그대로 사용하는 것과 같이 DBA 들이 흔히 저지르는 실수를 반복하지 말기 바란다. 이 숫자는 NT
서버의 여유 메모리에서 얼마만큼의 RAM을 SQL Server가 사용할 수 있는가를 지정하는 것이다. 필자는 RAM
이 2GB인 시스템을 포함하여 디폴트 메모리로 설정된 SQL Server 6.5 시스템을 많이 보았다.
SQL Server 6.5는 7.0이나 2000 버전과는 달리 메모리를 동적으로 설정하는 기능을 가지고 있지 않기 때문에
DBA가 직접 늘려 주어야 한다. [6.5]
(마이크로소프트의 보다 자세한 정보 :
http://www.microsoft.com/technet/SQL/Technote/sqliopt.asp)
*****
작업 내용을 확실히 이해하고 있고 지금 하고 있는 SQL Server 의 설정 변경 작업이 성능 향상에 도움이 된다
는 공정한 실험 결과를 가지고 있지 않는 한 함부로 서버의 성능에 영향을 줄 수 있는 SQL Server 의 설정 사
항을 변경하지 말기 바란다. 많은 경우에 있어서 문제를 해결하기 보다는 오히려 더 많은 문제를 일으킬 가능
성이 크다. [6.5, 7.0, 2000]
*****
SQL Server는 자동으로 튜닝이 되긴 하지만 SQL Server가 내부적인 세팅의 최적 값을 찾아내기 까지는 SQL
Server가 겪는 활동의 종류와 레벨에 따라서 대략 수 시간정도 소요된다. SQL Server 서비스가 처음 기동 되
면 SQL Server는 디폴트 환경 세팅으로부터 시작하게 된다. 데이터베이스에 대한 작업이 진행되고 쿼리가 실
행되면서 SQL Server는 자체적으로 정밀하게 튜닝을 하게 되고 시간이 흐를 수록 성능이 증가한다.
이런 점에서 보았을 때 SQL Server가 자체적으로 튜닝할 수 있을 때까지는 정확한 퍼포먼스 모니터 결과를 얻
는 것을 기대하지 않는 편이 좋다. SQL Server가 튜닝될 수 있도록 mssqlserver 서비스가 기동 된 후에 어느
정도의 시간 여유를 주도록 한다. [7.0, 2000]
*****
SQL Server의 옵션은 일반 옵션과 고급 옵션으로 구분된다. sp_configure를 사용해서 고급 옵션을 변경하려
면 고급 옵션을 사용 가능하게 하는 스토어드 프로시저를 먼저 실행해야 한다. 이 때 사용되는 명령은
sp_configure "show advanced options", 1 이다. [6.5, 7.0, 2000]
*****
여러 개의 CPU가 장착된 시스템이 100% 풀 가동중일 때 CPU 사용도를 줄일 수 있는 다른 방법이 없는 경우에
는 NT의 파이버(fibers)를 사용해서 성능을 향상 시킬 수 있다. 파이버는 쓰레드와 유사하게 동작하는 쓰레드
의 서브 컴포퍼넌트이다. 파이버를 사용하면 여러 개의 CPU를 사용하는 시스템에서 CPU간의 스위치 시에 오
버헤드가 적다는 장점이 있다.
CPU가 최대로 사용되는 상황이 아니라면 파이버를 사용해도 별 효과는 없으므로 이 옵션을 선택하지 않도록
한다. 또한 이렇게 설정하기 전과 후의 성능 변화도 자세하게 테스트 해야 한다. 이 옵션은 SQL Server
의 "Properties" 의 "Processor" 탭에서 찾을 수 있다. [7.0, 2000]
(마이크로소프트의 보다 자세한 정보 :
http://msdn.microsoft.com/library/techart/storageeng.htm#storageeng_procplan)
*****
고속의 디스크 컨트롤러가 장착된 서버에서는 SQL Server 환경 설정에서 "Max Async IO"를 변경함으로써
I/O 성능을 향상 시킬 수 있다. 디폴트는 32 이며 최대 값은 255 이다. 여러분의 서버에서 최적의 값을 찾기 위
해서는 여러 가지로 변경해 가면서 테스트 해봐야 한다.
적절한 "Max Async IO" 값은 대략 동시에 I/O가 가능한 물리적인 드라이브 개수에 2 또는 3을 곱한 값이다.
이 옵션을 변경한 다음에는 매번 SQL Server를 재기동 해야 하므로 운영중인 서버에서는 테스트하지 말기 바
란다. 이 값을 너무 높게 설정하면 디스크 작업의 적체가 발생하는데 퍼포먼스 모니터로 보면 Physical Disk
객체의 Disk Queue Length 가 물리적 드라이브마다 2를 넘어서게 되며 이것은 I/O에서 병목 현상이 발생함을
의미한다. [6.5, 7.0, 2000]
(마이크로소프트의 보다 자세한 정보 :
http://support.microsoft.com/support/kb/articles/Q112/5/39.asp)
*****
삽입, 갱신, 삭제 작업을 많이 하는 OLTP 프로그램이 매우 활발하게 실행된다면 "recovery interval"의 디폴트
값인 0는 적절하지 않다(0은 SQL Server가 적절한 recovery interval을 결정한다는 것을 의미함). 퍼포먼스 모
니터로 관찰했을 때 규칙적으로 디스크 쓰기 작업이 100%까지 이르는 경우가 발생하면(체크포인트 시에 발생
되는 것으로 추정) "recovery interval"을 5 정도로 높게 설정해야 한다. [6.5, 7.0, 2000]
(마이크로소프트의 보다 자세한 정보 :
http://msdn.microsoft.com/library/default.asp?
URL=/library/psdk/sql/8_tr_01_22.htm)
*****
데이터베이스의 모든 테이블이 SQL Server의 버퍼에 들어가지는 않고 다른 것에 비해서 매우 자주 사용되는
작은 테이블이 하나 이상 존재한다면 이 테이블들을 SP_TABLEOPTION PINTABLE 옵션을 사용하여 버퍼에 고
정시키는 것을 고려해 보도록 한다. 이렇게 하면 테이블이 일단 버퍼에 로드된 후에는 계속해서 강제적으로
버퍼에 머물게 된다.
그러면 이들 테이블이 사용될 때 필요한 디스크 I/O가 감소하게 된다. 큰 테이블을 메모리에 고정시키면 SQL
Server가 보다 유용하게 사용할 수 있는 중요한 버퍼 영역을 차지해 버리게 되므로 주의하여야 한다. [6.5,
7.0, 2000]
(마이크로소프트의 보다 자세한 정보 :
http://msdn.microsoft.com/library/default.asp?
URL=/library/psdk/sql/sp_ta-tz_3.htm)
*****
SQL Server와 통신하는 클라이언트의 네트워크 패킷 크기는 디폴트로 4096 바이트이다. 대부분의 경우 이 값
은 최적의 값이지만 특별한 경우에는 이것을 변경할 필요가 있다. 만약 클라이언트가 규칙적으로 큰 텍스트
나 이미지 데이터를 SQL Server로 전송한다거나, 대규모의 BCP 또는 DTS 작업을 수행하는 경우 패킷 크기를
늘려주면 오고 가는 네트워크 패킷의 숫자가 줄어들므로 성능을 향상시킬 수 있다. 반대로 응용 프로그램이
작은 데이터만을 주고 받을 때에는 패킷 크기를 줄여줌으로써 응답성을 향상시킬 수 있다.
SQL Server에서 설정한 패킷 크기는 클라이언트 소프트웨어에 의해서 변경될 수 있음을 기억해야 한다. 여러
분이 네트워크 트래픽 분석에 매우 익숙하고 작업 후의 성능 변화를 테스트할 수 있는 능력이 있는 경우에만
이 값을 변경하는 것이 좋다. [6.5, 7.0, 2000]
(마이크로소프트의 보다 자세한 정보 :
http://msdn.microsoft.com/library/psdk/sql/1_server_48.htm)
*****
서버에 물리적인 RAM이 충분한 상태에서 해쉬나 정렬 작업과 같이 메모리를 집중적으로 사용하는 쿼리와 동
시에 실행되는 쿼리가 많다면 SQL Server 옵션에서 "min memory per query" 옵션을 디폴트인 1024K 보다 늘려
보도록 한다. SQL Server가 자동으로 할당하는 최소한의 메모리를 지정하는 것으로 이 값을 늘려주면 메모리
를 많이 사용하는 쿼리의 성능이 향상된다.
반대로 이 옵션을 너무 크게 설정하면 쿼리가 오히려 느려지게 된다. SQL Server가 이 값에 지정한 만큼의 메
모리를 할당하거나 "query wait" 옵션에 지정한 값이 초과될 때까지는 쿼리가 실행되지 않기 때문이다. 여러분
의 환경에 맞는 적절한 값을 찾기 위해서는 여러 가지로 변경해 가면서 테스트 해야 한다. [7.0, 2000]
(마이크로소프트의 보다 자세한 정보 :
http://msdn.microsoft.com/library/psdk/sql/1_server_46.htm)
*****
SQL Server가 OLTP 프로그램만을 수행하고 OLAP 프로그램은 전혀 사용하지 않는다면 "max degree of
parallelism"을 1로 설정하여 병렬 처리를 하지 않도록 해 본다. 디폴트는 "0"이며 모든 CPU에 걸쳐서 병렬 처
리를 하도록 되어 있다. CPU가 하나인 경우에는 "max degree of parallelism" 값은 무시된다.
여러 개의 CPU가 있는 경우 디폴트로 병렬 처리를 하게 되는데 쿼리 옵티마이저가 각 쿼리에 대해서 병렬 처
리가 가능한지 평가하는데 약간의 오버헤드가 발생한다. 대부분의 OLTP 서버에서는 실행되는 쿼리의 특성
상 병렬 처리가 불가능한 경우가 많다. 이렇기 때문에 쿼리 옵티마이저는 각 쿼리가 병렬 처리로부터 이득을
볼 수 있을지 평가하기 위해서 시간을 소비하게 된다. 만약 쿼리가 병렬로 실행될 필요가 없다는 것을 미리 알
고 있는 경우에는 이 기능을 OFF 시켜서 쿼리의 평가에 걸리는 시간을 줄임으로써 약간의 오버헤드를 감소시
킬 수 있다.
물론 SQL Server에서 실행되는 쿼리의 성격상 병렬 처리의 장점을 이용할 수 있는 것이라면 병렬 처리를 OFF
시킬 필요는 없다. 이 기능을 사용했을 때 여러분의 환경에서 SQL Server의 성능 향상에 도움이 될지 아니면
해가 될지를 알기 위해서는 직접 테스트를 해봐야 한다. [7.0, 2000]
(마이크로소프트의 보다 자세한 정보 :
http://msdn.microsoft.com/library/psdk/sql/1_server_42.htm)
*****
서버를 SQL Server 전용으로 사용하고 있고 CPU가 여러 개 설치되어 있다면 SQL Server 옵션가운데 "priority
boost"를 디폴트인 0에서 1로 변경해 보도록 한다. 이렇게 하면 SQLServer의 sqlservr.exe 프로세스가 다른
프로세스보다 스케줄링 측면에서 높은 우선 순위(priority)를 부여 받게 된다. CPU가 여러 개인 시스템에서는
프로세스 우선 순위가 15에서 24로 변경되며 SQL Server의 성능이 약간 향상된다. 운영 환경에서 이 값을 사
용하기 전에 변경하기 전과 후의 성능 변화를 테스트하여 SQL Server에 도움이 되는지 확인해야 한다. [7.0,
2000]
(마이크로소프트의 보다 자세한 정보 :
http://msdn.microsoft.com/library/psdk/sql/1_server_50.htm)
*****
서버를 SQL Server 전용으로 사용하고 있고 CPU가 여러 개 설치되어 있다면 SQL Server 옵션 가운데 "time
slice"를 변경해 보도록 한다. 이 값은 SQL Server에 의해서 중단되지 않고 사용자 프로세스가 실행될 수 있는
시간(milliseconds)을 의미한다. 일반적으로 사용자 프로세스는 CPU 시간을 얼마만큼 사용할지를 자체적으
로 결정하여 적절하게 스케줄링 한다. 그러나 사용자 프로세스가 실행되는 시간이 "time slice" 값을 넘어서게
되면 SQL Server는 이 프로세스가 멈추었다고 판단하여 강제로 종료시킨다.
"time slice"의 디폴트 값은 100 milliseconds이다. "time slice"를 너무 작게 설정하면 오랫동안 수행된다는 이유
만으로 강제적으로 종료된 프로세스를 다시 스케줄링해서 실행해야 하기 때문에 추가적인 오버헤드가 발생
하여 시스템의 성능이 저하된다. "time slice"가 너무 크면 비정상적으로 멈춰버린 프로세스가 CPU 시간을 허
비하는 문제가 발생한다.
이 값을 어떻게 설정해야 할까를 결정하는 기준이 되는 중요한 요소가운데 하나는 CPU 성능이다. 만약 CPU
가 400MHz 이하의 속도라면 디폴트 값을 바꾸지 않는 것이 좋다. CPU가 400~600MHz의 속도를 가지고 있다
면 "time slice"는 200 milliseconds가 적당하고 600MHz 이상이라면 300 milliseconds로 설정해 보기 바란다. 이
값을 실제로 사용하기 전에 변경 전과 후에 SQL Server의 성능이 어떻게 변하게 되는지 테스트 해 봐야 한다.
[7.0, 2000]
(마이크로소프트의 보다 자세한 정보 :
http://msdn.microsoft.com/library/psdk/sql/1_server_64.htm)
*****
서버를 SQL Server 전용으로 사용한다면 SQL Server 옵션 가운데 "max worker threads"가 적절하게 설정되어
있는지 확인해 보기 바란다. 디폴트 값은 255이다. 이 옵션은 Windows NT 4.0에서 sqlservr.exe 프로세스에서
사용 가능한 작업 쓰레드(worker thread)의 수를 지정한다. 만약 동시 사용자가 255명 이하라면 각 사용자는
하나의 작업 쓰레드를 사용할 것이다. 그러나 동시 사용자가 255명을 넘어서면 SQL Server는 쓰레드 풀링을
사용하게 되는데 한명 이상의 사용자가 하나의 작업 쓰레드를 공유하게 된다. 쓰레드 풀링은 SQL Server에 의
해서 사용되는 시스템 리소스를 줄여주지만 대신 SQL Server를 사용하기 위한 사용자 커넥션의 경쟁이 증가
하게 된다.
최적의 성능을 위해서는 "max worker threads"를 서버를 사용하는 최대 사용자 수에 5를 더한 값으로 설정한
다. 이렇게 하면 동시 사용자 수가(더하기 5) 255 이하라면 SQL Server가 리소스를 다른 곳에 사용할 수 있도
록 해 주며 동시 사용자 수가(더하기 5) 255명을 넘어선다면 사용자 커넥션이 리소스를 차지하기 위해서 경쟁
할 것을 걱정할 필요가 없다. 하지만 추가적인 작업 쓰레드가 물리적인 RAM을 사용한다는 점을 잊
어서는 안된다. 따라서 이미 서버의 물리적인 RAM이 한계 치에 도달했다면 "max worker threads"를 디폴트인
255 이상으로 설정하지 말기 바란다. 그러나 물리적인 RAM에 여유가 있다면 위에서 설명한 것처럼 "max
worker threads"를 키워서 최대한 활용하도록 한다.
이 옵션을 운영 환경에서 사용하기 전에 변경 전과 후의 성능을 테스트하여 SQL Server가 이득을 볼 수 있는
지 확인해 보아야 한다. [7.0, 2000]
(마이크로소프트의 보다 자세한 정보 :
http://msdn.microsoft.com/library/psdk/sql/1_server_44.htm)
4. Tempdb I/O에 관한 팁
SQL Server의 tempdb 데이터베이스가 응용 프로그램에 의해서 과도하게 사용된다면 tempdb를 별도의 디스
크 어레이에 위치시키도록 한다(RAID 1 또는 RAID 10 같은). [6.5, 7.0, 2000]
*****
SQL Server가 설치된 다음에 tempdb 데이터베이스를 옮기고자 한다면 아래의 스크립트를 사용하여 적절한
위치로 이동시키면 된다.
USE master
go
ALTER DATABASE tempdb MODIFY FILE (NAME = tempdev, FILENAME = E: empdb.mdf)
go
ALTER DATABASE tempdb MODIFY FILE (NAME = templog, FILENAME = E: emplog.ldf)
go
여기서 NAME은 tempdb 데이터베이스와 로그 파일의 논리적인 이름이며 FILENAME은 tempdb 파일의 새로운
위치를 가리킨다. [7.0, 2000]
*****
응용 프로그램에서 tempdb 데이터베이스를 많이 사용하여 디폴트로 설정된 크기보다 커진다면 tempdb의 디
폴트 크기를 응용 프로그램에서 실제로 사용되는 크기에 가깝게 늘리도록 한다. SQLServer 서비스
(mssqlserver)가 기동 될 때 마다 tempdb 파일이 디폴트 크기로 재생성 되기 때문이다. tempdb 파일이 사용 중
에 커질 수는 있지만 이 작업을 위해서 어느 정도의 리소스가 소비된다. SQL Server가 기동 될 때 tempdb 파일
의 크기를 적절하게 설정하면 운영 중에 tempdb가 확장되면서 발생하는 오버헤드를 걱정할 필요가 없다.
[7.0, 2000]
5. Cursor에 관한 팁
가능하다면 SQLServer의 커서를 사용하지 않는 것이 좋다. 일반적으로 커서는 SQL Server의 리소스를 많
이 잡아 먹을 뿐 아니라 프로그램의 성능과 확장성을 떨어뜨리게 된다. 만약 레코드 단위로 처리를 해야 하는
경우라면 커서 대신에 다른 방법을 찾아보기 바란다. 클라이언트에서 작업을 처리하거나, 서버에서 tempdb
데이터베이스의 테이블을 이용해도 되고 correlated sub-query를 사용하는 것도 좋은 대안이 될 수 있다. 때로
는 커서를 대신할 수 있는 방법이 전혀 없는 경우도 물론 있다. [6.5, 7.0, 2000]
(마이크로소프트의 추가 정보 :
http://msdn.microsoft.com/library/default.asp?
URL=/library/psdk/sql/8_con_07.htm)
*****
각 레코드 별로 처리를 해야 하지만 가져오고자 하는 레코드의 개수가 많지 않다면 서버 쪽의 커서를 사용하
지 않도록 한다. 그 대신 전체 레코드를 클라이언트로 넘긴 다음 클라이언트에서 레코드 별로 필요한 작업을
수행한 후 결과를 다시 서버로 보내는 형식으로 처리한다. [6.5, 7.0, 2000]
*****
커서를 사용할 수 밖에 없는 상황이라면 forward-only 및 read_only 커서를 사용하는 것이 좋다. 이 커서는
SQL Server에 가장 적은 오버헤드를 발생시킨다. [6.5, 7.0, 2000]
*****
응용 프로그램에서 커서를 사용할 수 밖에 없는 형편이라면 최고의 성능을 내기 위해서는 SQL Server의
tempdb 데이터베이스를 별도의 물리적인 디바이스에 위치시키도록 한다. 커서는 커서 데이터를 임시로 저장
하기 위해서 tempdb를 사용하기 때문이다. 디스크 어레이의 성능이 좋을 수록 커서의 속도도 빨라지게 된다.
[6.5, 7.0, 2000]
*****
커서를 사용하면 병행성(concurrency)이 떨어지기 때문에 불필요한 락킹(locking)과 블로킹(blocking)이 발생
할 소지가 있다. 이 문제를 해결하려면 가능한 READ_ONLY 커서를 사용하도록 하고 만약 수정 작업도 해야 한
다면 락킹을 줄이기 위해서 OPTIMISTIC 커서 옵션을 사용한다. 병행성(concurrency)을 저하시키는
SCROLL_LOCKS 커서 옵션의 사용은 피해야 한다. [6.5, 7.0, 2000]
(마이크로소프트의 추가 정보 :
http://msdn.microsoft.com/library/default.asp?
URL=/library/psdk/sql/8_con_07_20.htm)
이 글은 스프링노트에서 작성되었습니다.
'Install /Setup' 카테고리의 다른 글
| SQL 2012 Intergration Service 구성 항목 설정 (0) | 2014.08.21 |
|---|---|
| SQL 2008:: 삭제 레지스터리 (0) | 2010.08.17 |
| SQL Server 수동 시작 (1) | 2010.01.22 |
Procedure Cache
SQL 서버는 두가지 타입의 cache에 메모리를 할당한다.
1. procedure cache
2. buffer cache
procedure cache는 실행한 stored procedure의 쿼리 실행 계획이 저장되는 공간이고,
buffer cache는 디스크로부터 읽어 들인 데이터를 저장하는 공간이다.
그런데 SQL Server를 세팅하고 관리할 때 SQL Server 인스턴스에 할당할 전체 메모리의 크기는 설정할 수 있지만, 위 두가지 메모리 영역 별로 메모리를 할당 하는 방법 및 수단은 존재하지 않는다.
(심지어 두 영역에 어떤 비율이나 공식이나 방법으로 메모리가 할당되는지에 대한 문서조차 없다.)
각설하고...
SQL Server가 메모리를 할당하는 방식은... procedure cache에 할당할 메모리 크기를 서버환경으로부터 일정 공식을 사용하여 계산하여 할당하고, 나머지 공간을 buffer cache에 할당하는 방식이다.
procedure cache 크기를 계산 방법은 아래와 같다.
- 32bit 플랫폼
procedure cache는 AWE (Address Windowing Extension)영역에 존재할 수 없다.
따라서 SQL인스턴스에 할당된 메모리의 첫 2GB까지의 영역만을 사용할 수 있는데, 이 영역의 50%와 1GB 중 작은 양이 procedure cache로 할당된다.
- 64bit 플랫폼
SQL Server 2005 SP1 또는 그 이전인 경우, "SQL 인스턴스에 할당된 첫 8GB까지의 75% + 이후 56GB까지의 50% + 나머지 메모리의 25%"를 procedure cache에 할당한다.
예를 들어 시스템 메모리가 16GB이고 SQL 인스턴스에 할당된 메모리 15GB인 경우, procedure cache의 크기는 9.5GB (8GB * 0.75 + 7GB * 0.5)가 된다.
단, SQL Server 2005 SP2에서 이 계산 방식이 "SQL 인스턴스에 할당된 첫 4GB까지의 75% + 나머지 메모리의 10%"로 바뀌어, 위의 예와 같은 상황에서 procedure cache의 크기는 4.1GB (4GB * 0.75 + 11GB * 0.1)가 된다.
(출처 : http://searchsqlserver.techtarget.com/tip/0,289483,sid87_gci1316780,00.html
http://purumae.tistory.com/26)
이 글은 스프링노트에서 작성되었습니다.
'Common Admin' 카테고리의 다른 글
| SQL 2008 -New DataType-Date (0) | 2010.06.04 |
|---|---|
| SQLDMO (0) | 2010.06.04 |
| Admin::master db rebuild 방법 (0) | 2010.06.04 |
| Profiler (0) | 2010.06.04 |
Profiler
- 서버 및 데이터베이스 동작 모니터, 교착상태수, 치명적인 오류, 저자으로시저 및 Transact-SQL 문 추적, 로그인 동작 확인
- SQL 프로필러 데이터를 SQL Server 테이블이나 파일에 캡처해서 분석가능
- 캡처한 이벤트를 단계별로 재성
- SQL 프로필러는 일괄처리나 트랜잭션 시작과 같은 엔진 프로세스 이벤트를 추적할 수 있다.
템플릿
- 나만의 템플릿을 만들어서 필요한 부분만 보자.
- 이벤트 에서는 보안 감사/세션 정보는 제외해도 무관
- 경고>> Execution Warnigs 는 성능에 나쁜 영향을 줄때 프로시저 내에서 발생하는 모든 에러를 반환한다. 한번씩 잡아 보는것도 괜찮다.
- 기본1.tdf : 기본에 충실한 추적 템플릿
이벤트 범주
- 저장프로시저 범주 : 저장프로시저 생성으로 발생하는 이벤트 컬랙션
- 이벤트 클래스와 열의 상관 관계, 해당 이벤트를 가져와야 특정 정보가 발생한다.

- TSQL: 클라이언트로부터 SQL Server 인스턴스로 전달되는 Transact-SQL 문을 실행함으로 생성되는 이벤트 클래스 컬렉션입니다.

- 참고) 둘다 Batch가 아니라 단건을 해야 NestLevel, ObejctID를 가져올 수 있다. 이게 Read80Trace에서 있어야 분석이 가능한것 같음.
- 잠금: 잠금을 얻거나 취소, 해제 시 생성되는 이벤트 클래스의 컬렉션입니다.
- 잠금은 자주 발생하기 때문에 잠금 이벤트를 캡쳐하면 추적되는 서비스에 중대한 오버해드를 발생 할 수 있다.

Profiler 바로가기 키
| Ctrl+Shift+Delete | 추적 창 지우기 |
| Ctrl+F4 | 추적 창 닫기 |
| - | 추적 그룹화 축소 |
| Ctrl+C | 복사 |
| Alt+Delete | 추적 삭제 |
| + | 추적 그룹화 확장 |
| Ctrl+F | 찾기 |
| F3 | 다음 항목 찾기 |
| Shift+F3 | 이전 항목 찾기 |
| F1 | 사용 가능한 도움말 표시 |
| Ctrl+N | 새 추적 열기 |
| Alt+F7 | 설정 재생 |
| Ctrl+F10 | 커서까지 실행 |
| F5 | 재생 시작 |
| F11 | 단계 |
| Shift+F5 | 재생 중지 |
| F9 | 중단점 설정/해제 |
파일/테이블 저장
추적파일을 테이블에 저장할 수 있다. 파일로 저장해서 쿼리로 문제가 되는 부분을 필터링해서 개체를 찾는데 도움이 된다.
select * from ::fn_trace_gettable('D:\gettable_test.trc',default)
SELECT IDENTITY(int, 1, 1) AS RowNumber, * INTO #temp_trc
FROM ::fn_trace_gettable('D:\gettable_test.trc', default)
SELECT * FROM #temp_trc
- 분석하기
ALTER TABLE #temp_trc ADD sql varchar(6000) : TextData는 text 타입이므로 정렬에 사용할 수 없으므로 변경
UPDATE #temp_trc SET sql = convert(varchar(6000), TextData)
select convert(varchar(80), sql), count(*) 횟수, avg(duration) dr, avg(cpu) c, avg(reads) r, avg(writes ) w
from #temp_trc
group by convert(varchar(80), sql)
order by count(*) desc
Profiler 스크립트로 실행하기
- 프로필러를 스크립트로 실행할 수 있다. UI로 실행하게 되면 아무래도 부하가 걸린다.
- 필요한 이벤트, 컬럼을 지정해서 가능하다. 쉽게 하기 위해서는 자주 쓰는 템플릿을 불러와서 파일>>추적스크립트를 실행해서 변환을 하면 스크립트가 생성된다.
- 추적은 다음과 같은 순서로 실행하면 된다.
- sp_trace_create: Trace를 생성한다.
- sp_trace_setevent: 해당 Trace에 이벤트와 컬럼 명을 지정한다.
- sp_trace_setfilter: 필터를 지정해서 원하는 값만 볼수 있다.
- 추적이 실행되고 나서 상태확인/중지
- fn_trace_getfilterinfo : TraceId 정보를 확인할 수 있음
- sp_trace_status @TraceId, 0 : 추적중지 -> sp_trace_status @TraceId, 2 : 추적 삭제
- 스크립트 저장프로시저로 만들기
이 글은 스프링노트에서 작성되었습니다.
'Common Admin' 카테고리의 다른 글
| SQL Server의 Procedure Cache 사이즈 (0) | 2010.06.04 |
|---|---|
| Admin::master db rebuild 방법 (0) | 2010.06.04 |
| 문서화되지 않은 프로시저 (0) | 2010.06.04 |
| Raid구성성능 (0) | 2010.06.04 |
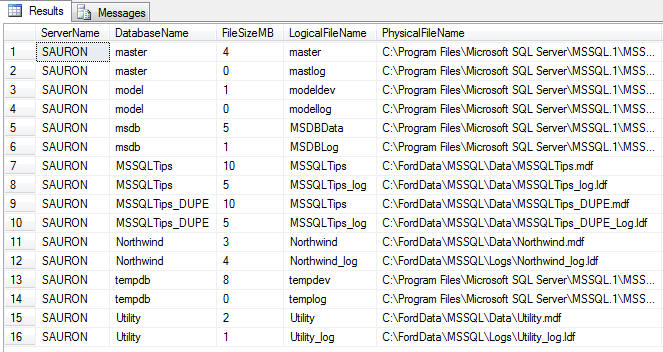
sp_MSforeachtable
Overview
Microsoft provides two undocumented Stored Procedures that allow you to process through all tables in a database, or all databases in a SQL Server instance. The first Stored Procedure (SP), "sp_MSforeachtable," allows you to easily process some code against every table in a single database. The other SP, "sp_MSforeachdb," will execute a T-SQL statement against every database associated with the current SQL Server instance. Let me go through each of these Stored Procedures in a little more detail.
sp_MSforeachtable
The "sp_MSforeachtable" SP comes with SQL Server, but it is not documented in Books Online. This SP can be found in the "master" database and is used to process a single T-SQL command or a number of different T-SQL commands against every table in a given database. To demonstrate how this SP works and how I think it is simpler to use then coding a CURSOR let me go through an example.
Say I want to build a temporary table that will contain a series of records; one for each table in the database and where each row contains the table name and the row count for the given table. To do this you would want to run a command like, "select '<mytable>', count(*) from <mytable>" where "<mytable>" was replaced with every table in your database and insert the results into my temporary table. So now, let's look at how we might do this using a CURSOR and then using the undocumented SP "sp_MSforeachtable".
Here is my code for getting the row counts for each table in a database using a CURSOR:
use pubs
go
set nocount on
declare @cnt int
declare @table varchar(128)
declare @cmd varchar(500)
create table #rowcount (tablename varchar(128), rowcnt int)
declare tables cursor for
select table_name from information_schema.tables
   where table_type = 'base table'
open tables
fetch next from tables into @table
while @@fetch_status = 0
begin
  set @cmd = 'select ''' + @table + ''', count(*) from ' + @table
  insert into #rowcount exec (@cmd)
  fetch next from tables into @table
end
CLOSE tables
DEALLOCATE tables
select top 5 * from #rowcount
    order by tablename
drop table #rowcount
Here is the output of my CURSOR example when the above code in run on my machine:
tablename       rowcnt
-------------   -----------
authors         23
discounts       3
employee        43
jobs            8
pub_info        8
Now here is my code that produces similar results using the undocumented SP "sp_MSforeachtable":
use pubs
go
create table #rowcount (tablename varchar(128), rowcnt int)
exec sp_MSforeachtable
   'insert into #rowcount select ''?'', count(*) from ?'
select top 5 * from #rowcount
    order by tablename
drop table #rowcount
Here is the output from the above code when run on my machine:
tablename         rowcnt
----------------- -----------
[dbo].[authors]   23
[dbo].[discounts  3
[dbo].[employee]  43
[dbo].[jobs]      14
[dbo].[pub_info]  8
As you can see both the CURSOR example and the "sp_MSforeachtable" code produce relatively the same results. Which one do you think is easier to read and code? Let's look a little closer at how to use the undocumented SP "sp_MSforeachtable".
Below is the syntax for calling the sp_MSforeachtable SP:
exec @RETURN_VALUE=sp_MSforeachtable @command1, @replacechar, @command2,
  @command3, @whereand, @precommand, @postcommand
Where:
- @RETURN_VALUE - is the return value which will be set by "sp_MSforeachtable"
- @command1 - is the first command to be executed by "sp_MSforeachtable" and is defined as a nvarchar(2000)
- @replacechar - is a character in the command string that will be replaced with the table name being processed (default replacechar is a "?")
- @command2 and @command3 are two additional commands that can be run for each table, where @command2 runs after @command1, and @command3 will be run after @command2
- @whereand - this parameter can be used to add additional constraints to help identify the rows in the sysobjects table that will be selected, this parameter is also a nvarchar(2000)
- @precommand - is a nvarchar(2000) parameter that specifies a command to be run prior to processing any table
- @postcommand - is also a nvarchar(2000) field used to identify a command to be run after all commands have been processed against all tables
As you can see, there are quite a few options for the "sp_MSforeachtable" SP. Let's go through a couple of different examples to explore how this SP can be used to process commands against all the tables, or only a select set of tables in a database.
First let's build on our original example above and return row counts for tables that have a name that start with a "p." To do this we are going to use the @whereand parameter. Here is the code for this example:
use pubs
go
create table #rowcount (tablename varchar(128), rowcnt int)
exec sp_MSforeachtable
 @command1 = 'insert into #rowcount select ''?'',
              count(*) from ?',
 @whereand = 'and name like ''p%'''
select top 5 * from #rowcount
    order by tablename
drop table #rowcount
On my machine, the above code produced the following output:
tablename          rowcnt
------------------ -----------
[dbo].[pub_info]   8
[dbo].[publishers] 8
By reviewing the code above, you can see I am now using the @command1, and the @whereand parameter. The @whereand parameter above was used to constrain the WHERE clause and only select tables that have a table name that starts with a "p." To do this I specified "and name like ''p%''" for the @whereand parameter. If you needed to have multiple constraints like all tables that start with "p," and all the tables that start with "a," then the @whereand parameter would look like this:
and name like ''p%'' or name like ''a%''
Note, that in the @command1 string in the above example there is a "?". This "?" is the default replacement character for the table name. Now if for some reason you need to use the "?" as part of your command string then you would need to use the @replacechar parameter to specify a different replacement character. Here is another example that builds on the above example and uses the "{" as the replacement character:
create table #rowcount (tablename varchar(128), rowcnt int)
exec sp_MSforeachtable
 @command1 = 'insert into #rowcount select
             ''Is the rowcount for table {?'',
             count(*) from {',
 @replacechar = '{',
 @whereand = 'and name like ''p%'''
select tablename as question, rowcnt from #rowcount
    order by tablename
drop table #rowcount
Here is the output from this command on my machine:
question                                         rowcnt
------------------------------------------------ -----------
Is the rowcount for table [dbo].[pub_info]?      8
Is the rowcount for table [dbo].[publishers]?    8
There are two more parameters to discuss, @percommand, and @postcommand. Here is an example that uses both of these commands:
exec sp_MSforeachtable
 @command1 = 'print ''Processing table ?''',
 @whereand = 'and name like ''p%''',
 @precommand = 'Print ''precommand execution '' ',
 @postcommand = 'Print ''postcommand execution '' '
Here is the output from this command when run on my machine:
precommand execution
Processing table [dbo].[pub_info]
Processing table [dbo].[publishers]
postcommand execution
As you can see, the "PRINT" T-SQL command associated with the "@precommand" parameter was only executed once, prior to processing through the tables. Whereas, the "@postcommmand" statement was executed after all the tables where processed, and was only executed once. Using the pre and post parameters would be useful if I had some processing I wanted done prior to running a command against eachnly executed once. clause and table, and/or I needed to do some logic after all tables where processed.
sp_MSforeachdb
The SP "sp_MSforeachdb" is found in the "master" database. This SP is used to execute a single T-SQL statement, like "DBCC CHECKDB" or a number of T-SQL statements against every database defined to a SQL Server instance. Here is the syntax for calling this undocumented SP:
exec @RETURN_VALUE = sp_MSforeachdb @command1, @replacechar,
  @command2, @command3, @precommand, @postcommand
Where:
- @RETURN_VALUE - is the return value which will be set by "sp_MSforeachdb"
- @command1 - is the first command to be executed by "sp_MSforeachdb" and is defined as nvarchar(2000)
- @replacechar - is a character in the command string that will be replaced with the table name being processed (default replacechar is a "?")
- @command2 and @command3 are two additional commands that can be run against each database
- @precommand - is a nvarchar(2000) parameter that specifies a command to be run prior to processing any database
- @postcommand - is also an nvarchar(2000) field used to identify a command to be run after all commands have been processed against all databases.
The parameters for sp_MSforeachdb are very similar to sp_MSforeachtable. Therefore, there is no need to go over some of the parameters since they provide the same functionality as I described in the sp_MSforeachtable section above.
To show you how the "sp_MSforeachdb" SP works let me go through a fairly simple example. This example will perform a database backup, then a "DBCC CHECKDB" against each database. Here is the code to perform this:
declare @cmd1 varchar(500)
declare @cmd2 varchar(500)
declare @cmd3 varchar(500)
set @cmd1 =
   'if ''?'' <> ''tempdb'' print ''*** Processing DB ? ***'''
set @cmd2 = 'if ''?'' <> ''tempdb'' backup database ? to disk=''c:\temp\?.bak'''
set @cmd3 = 'if ''?'' <> ''tempdb'' dbcc checkdb(?)'
exec sp_MSforeachdb @command1=@cmd1,
                    @command2=@cmd2,
                    @command3=@cmd3
Here you can see that I am really processing three different commands. The first command is just a "PRINT" statement so you can easily review the output by database. Remember how "sp_MSforeachtable" SP had a parameter where you could constrain what tables where processed, there is no parameter that provides this type of functionality in the "sp_MSforeachdb" SP. Since SQL Server does not allow the "tempdb" database to be backed up I needed a way to skip that database. This is why I have used the "IF" statement in each of the commands I processed. The second command (@command2) processes the databases backup, and the last command (@command3) will run a "DBCC CHECKDB" command against all databases except the "tempdb" database.
Comments on Using Undocumented SQL Server Stored Procedures
Some level of testing and care should be taken when using undocumented code from Microsoft. Since these SP's are not documented, it means that Microsoft might change this code with any new release or patch without notifying customers. Because of this, you need to thoroughly test any code you write that uses these undocumented SPs against all new releases of SQL Server. This testing should verify that your code still functions as it did in old releases.
Conclusion
As you can see, these undocumented Stored Procedures are much easier to use than using a CURSOR. Next time you need to iteratively run the same code against all tables, or all databases consider using these undocumented Stored Procedures. Although, remember these Stored Procedures are undocumented and therefore Microsoft may change their functionality at anytime.
이 글은 스프링노트에서 작성되었습니다.
'Common Admin' 카테고리의 다른 글
| Admin::master db rebuild 방법 (0) | 2010.06.04 |
|---|---|
| Profiler (0) | 2010.06.04 |
| Raid구성성능 (0) | 2010.06.04 |
| DB파일사이즈 (1) | 2010.06.04 |
데이터베이스 사이즈 측정
- DB파일사이즈
- Estimating the size of Table
-
(Heap 사이즈 혹은 클러스터 인덱스 사이즈) + 넌 클러스터 인덱스 사이즈의 합
-
사이즈 계산법으로 말고 sp_spaceused 에 datasize와 인덱스 사이즈를 보고 테이블 전체 사이즈를 아는것과 다른가?
-
sp_spaceused 프로시저 확인해 보기 : 확인해 보니 복잡하지 않고 윗 부분과 동일한 것 같음
- --=====================================================
- - 테이블 사이즈
-
--======================================================
-
SELECT
-
@reservedpages = SUM (reserved_page_count),
-
@usedpages = SUM (used_page_count),
-
@pages = SUM (
-
CASE
-
WHEN (index_id < 2) THEN (in_row_data_page_count + lob_used_page_count + row_overflow_used_page_count)
-
ELSE lob_used_page_count + row_overflow_used_page_count
-
END
-
),
-
@rowCount = SUM (
-
CASE
-
WHEN (index_id < 2) THEN row_count
-
ELSE 0
-
END
-
)
-
FROM sys.dm_db_partition_stats
-
WHERE object_id = @id;
-
-
SELECT
-
name = OBJECT_NAME (@id),
-
rows = convert (char(11), @rowCount),
-
reserved = LTRIM (STR (@reservedpages * 8, 15, 0) + ' KB'),
-
data = LTRIM (STR (@pages * 8, 15, 0) + ' KB'),
-
index_size = LTRIM (STR ((CASE WHEN @usedpages > @pages THEN (@usedpages - @pages) ELSE 0 END) * 8, 15, 0) + ' KB'),
-
unused = LTRIM (STR ((CASE WHEN @reservedpages > @usedpages THEN (@reservedpages - @usedpages) ELSE 0 END) * 8, 15, 0) + ' KB')
-
-
이 글은 스프링노트에서 작성되었습니다.
'T-SQL' 카테고리의 다른 글
| Index::Defrag Script v4.0 (0) | 2010.06.15 |
|---|---|
| T_SQL::미 사용 Table (0) | 2010.06.15 |
| T-SQL::Removing Duplication Data (1) | 2010.06.03 |
| T-SQL::DB_Restore_move_to (0) | 2010.06.03 |
Riad 구성에 따른 성능 차이
CREATE TABLE TestA (a int, b int)
GO
DECLARE @time DATETIME, @i INT
SET @i = 1
SET @time = GETDATE()
WHILE 10000 >= @i
BEGIN
INSERT TestA (a, b) VALUES (@i, @i)
SET @i = @i + 1
END
SELECT DATEDIFF(ms, @time, GETDATE())
|
디스크구성<?xml:namespace prefix = o ns = "urn:schemas-microsoft-com:office:office" /?> |
Insert 건수 |
ms |
건수/초 |
비고 |
|
Raid 1 트랜젝선로그와 데이터 파일 물리적으로 함께 사용 |
10,000 |
65,610 |
153 |
현재 개발망 장비와 이와 같은 구성임 |
|
No Raid, 트랜젝선로그와 데이터 파일 물리적으로 함께 사용 |
10,000 |
2,440 |
4,098 |
개인 로컬 장비와 동일 |
|
Raid 1 + 0 트랜젝션 로그와 데이터 파일 물리적으로 분리 |
10,000 |
9,420 |
1,062 |
|
|
Raid 1 + 0 트랜젝션 로그와 데이터 파일 물리적으로 함께 사용 |
10,000 |
47,120 |
212 |
|
결과
결과를 보면, 레이드 구성은 하지 않는 것이 성능은 가장 좋습니다. 허나, 실제로는 레이드 구성을 하고 있고,
레이드 구성을 했을 경우에 적어도 트랜잭션 로그와 데이터 파일이 물리적으로 분리되어야 합니다. 부하테스트를 주고 있는 개발망 장비는 그렇지 못해서 정상적인 성능 테스트 결과를 얻을 수가 없습니다. 현재, 서비스망은 트랜잭션 로그와 데이터 파일이 분리되어 있습니다. (별차이가 없을 줄 알았는데 차이 많이 나네요.)
예를 들면) 개발망에 창고 차감의 경우 초당 50회 정도(insert/update 평균 3회) 나오는데 반해
트랜젝션 로그와 데이터 파일이 분리되어 있는 DB 장비의 경우에는 이론상으로 초당 300회가 가능한 것으로 보입니다.
이 글은 스프링노트에서 작성되었습니다.
'Common Admin' 카테고리의 다른 글
| Profiler (0) | 2010.06.04 |
|---|---|
| 문서화되지 않은 프로시저 (0) | 2010.06.04 |
| DB파일사이즈 (1) | 2010.06.04 |
| DBCC 명령어 (0) | 2010.06.04 |
Collecting database usage information for free space and trending
I find it important in my environment to monitor the following database/database file level metrics:
- Server/Instance Name
- Database Name
- Database File Names (both logical and full physical path)
- File Size (In Megabytes)
- Database Status
- Recovery Mode
- Free Space (In Megabytes and Percent)
To collect this information I need to tap into the either the master.dbo.sysfiles system table in SQL 2000 or master.sys.sysfiles compatibility view in SQL 2005. I also need to make use of a few T-SQL functions at the DBA's disposal. First, let me present the query. Afterwards I'll explain the finer points.
|
CAST(sysfiles.size/128.0 - CAST(FILEPROPERTY(sysfiles.name, ' + '''' + 'SpaceUsed' + '''' + ' ) AS int)/128.0 AS int) AS FreeSpaceMB
The FreeSpaceMB calculation is simple once you understand what I explained above for the calculations associated with FileSize. To determine free space we need to know how much of the total file space is being consumed. This information is exposed via the FILEPROPERTY() function. FILEPROPERTY() expects the following parameters: file name, and property.
Expect a future tip on the various uses for FILEPROPERTY(), but for now we focus on the SpaceUsed property. This value is also stored in 8Kb pages, so the factor of 1024/8 (or 128) remains constant. Using the same basic rules we discussed above this is what the formula would look like this: Available Space in Mb = (File Size in Mb) - (Space Used in Mb). The formula in the query casts all variables as integer data types and converts the available values from pages to Mb.
I know that one of the major foundations of database normalization is not storing calculated values in a database. However, I like to be able to trend my metadata over time and with the complexity of the formulas I prefer to do all my thinking up-front. That being said, I don't just store the size information in the table and run calculations in my queries after the fact - I do my calculations directly in the query that populates the repository.
이 글은 스프링노트에서 작성되었습니다.
'Common Admin' 카테고리의 다른 글
| 문서화되지 않은 프로시저 (0) | 2010.06.04 |
|---|---|
| Raid구성성능 (0) | 2010.06.04 |
| DBCC 명령어 (0) | 2010.06.04 |
| WMI Providers_2 (0) | 2010.06.04 |
DBCC 명령어, 문서와 되어 있거나 되어있지 않은것 정리
DBCC MEMORYSTATUS
Lists a breakdown of how the SQL Server buffer cache is divided up, including buffer activity. Undocumented command, and one that may be dropped in future versions of SQL Server.
참고 자료 : http://support.microsoft.com/kb/271624
DBCC PROCCACHE
프로시저 캐시에 대한 정보를 테이블 형식으로 표시합니다.
| 열 이름 | 설명 |
|---|---|
| num proc buffs | 프로시저 캐시에 저장할 수 있는 저장 프로시저의 개수 |
| num proc buffs used | 저장 프로시저를 보관하는 캐시 슬롯의 개수 |
| num proc buffs active | 현재 실행 중인 저장 프로시저를 보관하는 캐시 슬롯의 개수 |
| proc cache size | 프로시저 캐시의 전체 크기 |
| proc cache used | 저장 프로시저를 보관하는 프로시저 캐시의 용량 |
| proc cache active | 현재 실행 중인 저장 프로시저를 보관하는 프로시저 캐시의 용량 |
DBCC CACHESTATS
개첵들의 현재 버퍼에 있는 캐쉬 정보, SQL 2000, 7.0 버전에 적용
- Object Type Hit Ratio Object Count Avg Cost Avg Pages LW Object Count LW Avg Cost LW Avg Stay (ms) LW Avg Use Count
Proc 0 0 0 0 0 0 0 0
Prepared 0 0 0 0 0 0 0 0
Adhoc 0 0 0 0 0 0 0 0
ReplProc 0 0 0 0 0 0 0 0
Trigger 0 0 0 0 0 0 0 0
Cursor 0 0 0 0 0 0 0 0
Exec Cxt 0 0 0 0 0 0 0 0
View 0 0 0 0 0 0 0 0
Default 0 0 0 0 0 0 0 0
UsrTab 0 0 0 0 0 0 0 0
SysTab 0 0 0 0 0 0 0 0
Check 0 0 0 0 0 0 0 0
Rule 0 0 0 0 0 0 0 0
Summary 0 0 0 0 0 0 0 0
- Hit Ratio: Displays the percentage of time that this particular object was found in SQL Server's cache. The bigger this number, the better.
- Object Count: Displays the total number of objects of the specified type that are cached.
- Avg. Cost: A value used by SQL Server that measures how long it takes to compile a plan, along with the amount of memory needed by the plan. This value is used by SQL Server to determine if the plan should be cached or not.
- Avg. Pages: Measures the total number of 8K pages used, on average, for cached objects.
- LW Object Count, LW Avg Cost, WL Avg Stay, LW Ave Use: All these columns indicate how many of the specified objects have been removed from the cache by the Lazy Writer. The lower the figure, the better.
DBCC DROPCLEANBUFFERS
정확한 테스트를 할때 유용하게 사용되며 캐쉬의 버퍼를 깨끗하게 지운다. 그러나 dirty page를 처리하는것은 아니다. 단지 버퍼를 지우는 것이다.
버퍼 풀에서 빈 버퍼를 모두 제거합니다.
버퍼 풀에서 빈 버퍼를 삭제하려면 먼저 CHECKPOINT를 사용해 빈 버퍼 캐시를 만드십시오. 이 과정은 현재 데이터베이스에 대한 모든 커밋되지 않은 페이지를 디스크로 기록하고 버퍼를 비웁니다. 버퍼를 비운 후에 DBCC DROPCLEANBUFFERS 명령을 실행해 버퍼 풀에서 모든 버퍼를 제거할 수 있습니다.
SQL 2000, 7.0 에서 사용
DBCC ERRORLOG
자주 sql 서버를 재 시작하지 않으면 서버 에러 로그 파일이 커지게 된다. 에러로그 파일 하나를 끝내고 다시 새로 시작하게 만듭니다. (순환시킴)
Job으로 작업을 걸어도 된다. 같은 작업을 하는 프로시저가 sp_cycle_errorlog 임
DBCC FLUSHPROCINDB
데이터베이스가 사용하는 특수한 저장 프로시저를 캐쉬에서 삭제한다. 모두 다 삭제하는것은 아니다. 데이터베이스 아이디를 입력해서 특정 데이터베이스만도 가능하다.
상세 내역은 How to Interact with SQL Server's Data and Procedure Cache 참조 하여 읽어본다.
DBCC INDEXDEFRAG
인덱스 조각 모음.
온라인에서 사용가능하기 때문에 장시간의 테이블 lock을 걸지는 않는다. 해당 작업은 병렬로 처리 가능하지 않는다. 즉 한 테이블에 인덱스를 여러개 처리하라고 명령해도 한 인덱스 작업이 끝난 후에 다른 인덱스 조각모음을 실시한다.
2005에서는 ALTER INDEX 사용은 권고한다. 해당 명령어는 더 이상 사용하지 않는다.
- DBCC INDEXDEFRAG (Database_Name, Table_Name, Index_Name)
DBCC FREEPROCCACHE
모든 프로시저를 캐쉬에서 삭제한다. 테스트 시작 전에 사용하면 유용하다.
DBCC OPENTRAN
An open transaction can leave locks open, preventing others from accessing the data they need in a database. This command is used to identify the oldest open transaction in a specific database.
- DBCC OPENTRAN('database_name')
DBCC PAGE
Use this command to look at contents of a data page stored in SQL Server.
- DBCC PAGE ({dbid|dbname}, pagenum [,print option] [,cache] [,logical])
DBCC PINTABLE & DBCC UNPINTABLE
By default, SQL Server automatically brings into its data cache the pages it needs to work with. These data pages will stay in the data cache until there is no room for them, and assuming they are not needed, these pages will be flushed out of the data cache onto disk. At some point in the future when SQL Server needs these data pages again, it will have to go to disk in order to read them again into the data cache for use. If SQL Server somehow had the ability to keep the data pages in the data cache all the time, then SQL Server's performance would be increased because I/O could be significantly reduced on the server.
The process of "pinning a table" is a way to tell SQL Server that we don't want it to flush out data pages for specific named tables once they are read in in the first place. This in effect keeps these database pages in the data cache all the time, which eliminates the process of SQL Server from having to read the data pages, flush them out, and reread them again when the time arrives. As you can imagine, this can reduce I/O for these pinned tables, boosting SQL Server's performance.
To pin a table, the command DBCC PINTABLE is used. For example, the script below can be run to pin a table in SQL Server:
- DECLARE @db_id int, @tbl_id int
USE Northwind
SET @db_id = DB_ID('Northwind')
SET @tbl_id = OBJECT_ID('Northwind..categories')
DBCC PINTABLE (@db_id, @tbl_id)
이 기능은 SQL Server 버전 6.5에서 성능 개선을 위해 도입되었으나 DBCC PINTABLE은 아주 좋지 않은 부작용을 갖고 있습니다. 그 중에는 버퍼 풀 손상 가능성도 포함됩니다. DBCC PINTABLE은 더 이상 필요하지 않으며 추가적인 문제를 예방하기 위해 제거되었습니다. 이 명령의 구문은 계속 작동하지만 서버에 영향을 주지 않습니다.
DBCC REINDEX
Periodically (weekly or monthly) perform a database reorganization on all the indexes on all the tables in your database. This will rebuild the indexes so that the data is no longer fragmented. Fragmented data can cause SQL Server to perform unnecessary data reads, slowing down SQL Server's performance.
If you do a reorganization on a table with a clustered index, any non-clustered indexes on that same table will automatically be rebuilt.
Database reorganizations can be done scheduling SQLMAINT.EXE to run using the SQL Server Agent, or if by running your own custom script via the SQL Server Agent (see below).
Unfortunately, the DBCC DBREINDEX command will not automatically rebuild all of the indexes on all the tables in a database, it can only work on one table at a time. But if you run the following script, you can index all the tables in a database with ease.
- DBCC DBREINDEX('table_name', fillfactor)
DBCC SHOWCONTIG
인덱스에 대한 페이지 분할등 정보를 보여줌
If the scan density is less than 75%, then you may want to reindex the tables in your database reindex 추천
- DBCC SHOWCONTIG (Table_id, IndexID)
DBCC SHOW_STATISTICS
Used to find out the selectivity of an index. Generally speaking, the higher the selectivity of an index, the greater the likelihood it will be used by the query optimizer. You have to specify both the table name and the index name you want to find the statistics on.
-
DBCC SHOW_STATISTICS (table_name, index_name)
DBCC SQLMGRSTATS
Used to produce three different values that can sometimes be useful when you want to find out how well caching is being performed on ad-hoc and prepared Transact-SQL statements.
- Memory Used (8k Pages): If the amount of memory pages is very large, this may be an indication that some user connection is preparing many Transact-SQL statements, but it not un-preparing them.
- Number CSql Objects: Measures the total number of cached Transact-SQL statements.
- Number False Hits: Sometimes, false hits occur when SQL Server goes to match pre-existing cached Transact-SQL statements. Ideally, this figure should be as low as possible.
DBCC SQLPERF()
This command includes both documented and undocumented options. Let's take a look at all of them and see what they do.
DBCC UPDATEUSAGE
The official use for this command is to report and correct inaccuracies in the sysindexes table, which may result in incorrect space usage reports. Apparently, it can also fix the problem of unreclaimed data pages in SQL Server. You may want to consider running this command periodically to clean up potential problems. This command can take some time to run, and you want to run it during off times because it will negatively affect SQL Server's performance when running. When you run this command, you must specify the name of the database that you want affected.
DBCC UPDATEUSAGE는 테이블 또는 인덱스의 각 파티션에 대해 행, 사용된 페이지, 예약된 페이지, 리프 페이지 및 데이터 페이지의 개수를 수정합니다. 시스템 테이블에 부정확한 데이터가 없으면 DBCC UPDATEUSAGE는 데이터를 반환하지 않습니다. 부정확한 데이터를 검색 및 수정하고 WITH NO_INFOMSGS를 사용하지 않았으면 DBCC UPDATEUSAGE는 시스템 테이블에서 업데이트 중인 행과 열을 반환합니다.
-
DBCC UPDATEUSAGE ('databasename')
DBCC TRACESTATUS
추적 플래그 상태를 표시합니다.
이 글은 스프링노트에서 작성되었습니다.
'Common Admin' 카테고리의 다른 글
| Raid구성성능 (0) | 2010.06.04 |
|---|---|
| DB파일사이즈 (1) | 2010.06.04 |
| WMI Providers_2 (0) | 2010.06.04 |
| WMI Providers (1) | 2010.06.04 |
복제 삭제
- 방법 1: http://msdn.microsoft.com/ko-kr/library/ms152757.aspx
- 방법 2: http://support.microsoft.com/kb/324401
-
이상하게 잘 못 삭제했을 경우
-
select replinfo,* from sysobjects where replinfo = 0 을 찾아서 입력합니다.
-
sp_removedbreplication [ [ @dbname = ] 'dbname' ] [ , [ @type = ] type ] -
-
-
- [ @dbname=] 'dbname'
-
-
- 데이터베이스의 이름입니다. dbname은 sysname이며 기본값은 NULL입니다. NULL인 경우 현재 데이터베이스를 사용합니다.
-
-
- [ @type = ] type
-
-
- 데이터베이스 개체를 제거 중인 복제의 유형입니다. type은 nvarchar(5)이며 다음 값 중 하나일 수 있습니다.
- tran
- 트랜잭션 복제 게시 개체를 제거합니다.
- merge
- 병합 복제 게시 개체를 제거합니다.
- both(기본값)
- 모든 복제 게시 개체를 제거합니다.
-
ERROR CASE
게시& 배포자가 먼저 삭제되고 구독이 남아 있을 경우
이 글은 스프링노트에서 작성되었습니다.
'Replication' 카테고리의 다른 글
| 복제::숨겨진 저장프로시저 확인 (0) | 2011.01.16 |
|---|---|
| 복제::LOB DataType 제한 (0) | 2010.06.04 |
| 복제::머지복제에러 (0) | 2010.06.04 |
| 복제::스냅숏 DB를 사용한 게시 초기화 (0) | 2010.06.04 |
 Prev
Prev

